In the first article of this three-article series
We discussed how to optimize the different parts of a Chrome Web Store listing. In this article, we will talk about how to use analytics to optimize the listing for conversion. The sales funnel for an app consists of three major stages – discovery, conversion, and retention. The user discovers your extension, installs it, and either finds that the extension solves their problem or decides to uninstall it. Optimization is essential every step of the way to ensure that the goals for each stage are met. To reach the goal of making sure users continue using your app, i.e, retention, it is important to understand the user journey. This is only possible through gathering enough user data in the initial stages. This accumulated data can help gain valuable insights into the effectiveness of your extension which could help improve its subsequent iterations. To gather data, it is important that enough of the people who have landed on your listing install it, i.e. conversion. Your Chrome Web Store listing plays an essential part in making this happen.
Google Analytics
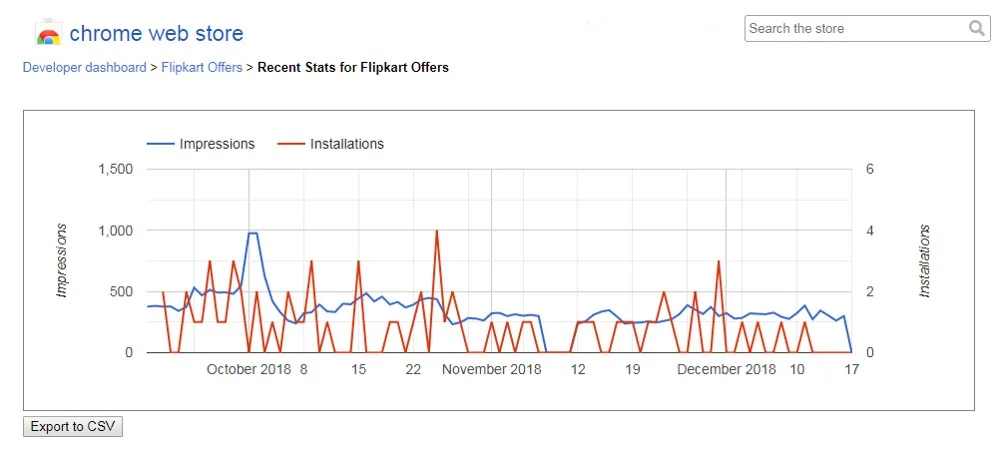
In order to tweak the listing for better conversion, we need data, to begin with that helps us measure the baseline conversion rate. Analytics are used to understand user behavior on the listing, such as how many visitors, which channels they come from, how many installs, types of installs, keywords used to search, etc. However, the analytic stats provided by Chrome Web Store are very basic. They fall short of giving us enough data to fully analyze the user behavior.
In order to get better, more detailed data, you can configure Google Analytics for your Chrome Web Store listing. Data thus acquired allows for a fuller analysis. Better data means a better conversion strategy. Now you can identify and effectively focus on those channels which have better conversion rates.
Dashboards
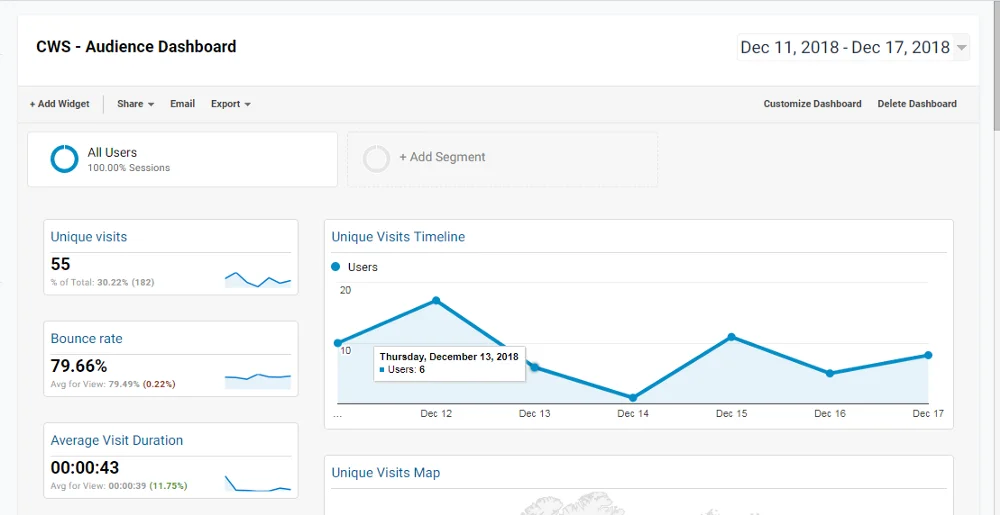
Once you configure Google Analytics, Chrome Web Store starts putting data in it. The raw data that results from this could be daunting and difficult to make sense of right away. To make it easy to read and analyze, we customize our own dashboards for Google Analytics. These dashboards are easy to create and import whenever needed. We have posted screenshots for you to see what our dashboards look like. Once you have configured Google Analytics and also have your customized dashboards, you are ready to measure the baseline as well as the changing baseline conversion rates.
The next step is to tweak each part of the listing, one at a time, and noting the resulting change in the conversion rate. For instance, you change a keyword in the title and notice if that increases or decreases the number of visitors that land on the listing via search results. We have already talked in detail about optimizing the different parts of your listing in the first part of this three-article series.
In a Nutshell
All the attention and footfall received from discovery is effective only if your listing is optimized for conversion. The data received from converted users also plays a huge role in improving the user journey thereby increasing the retention rate. In order to maximize conversion, you need to understand user behavior on the listing. The best way to do that is through analytics. By configuring Google Analytics on the listing, you get more detailed data that can then be used to tweak the listing for optimum conversion. In the next article, we will talk about how to track user behavior from within the extension using analytics and why it is significant for retention.


